Read the dashboard
Vibe Bar uses one overview and consistent provider-detail layouts so that quota, cost, activity, and status stay comparable.
Navigate the workspace
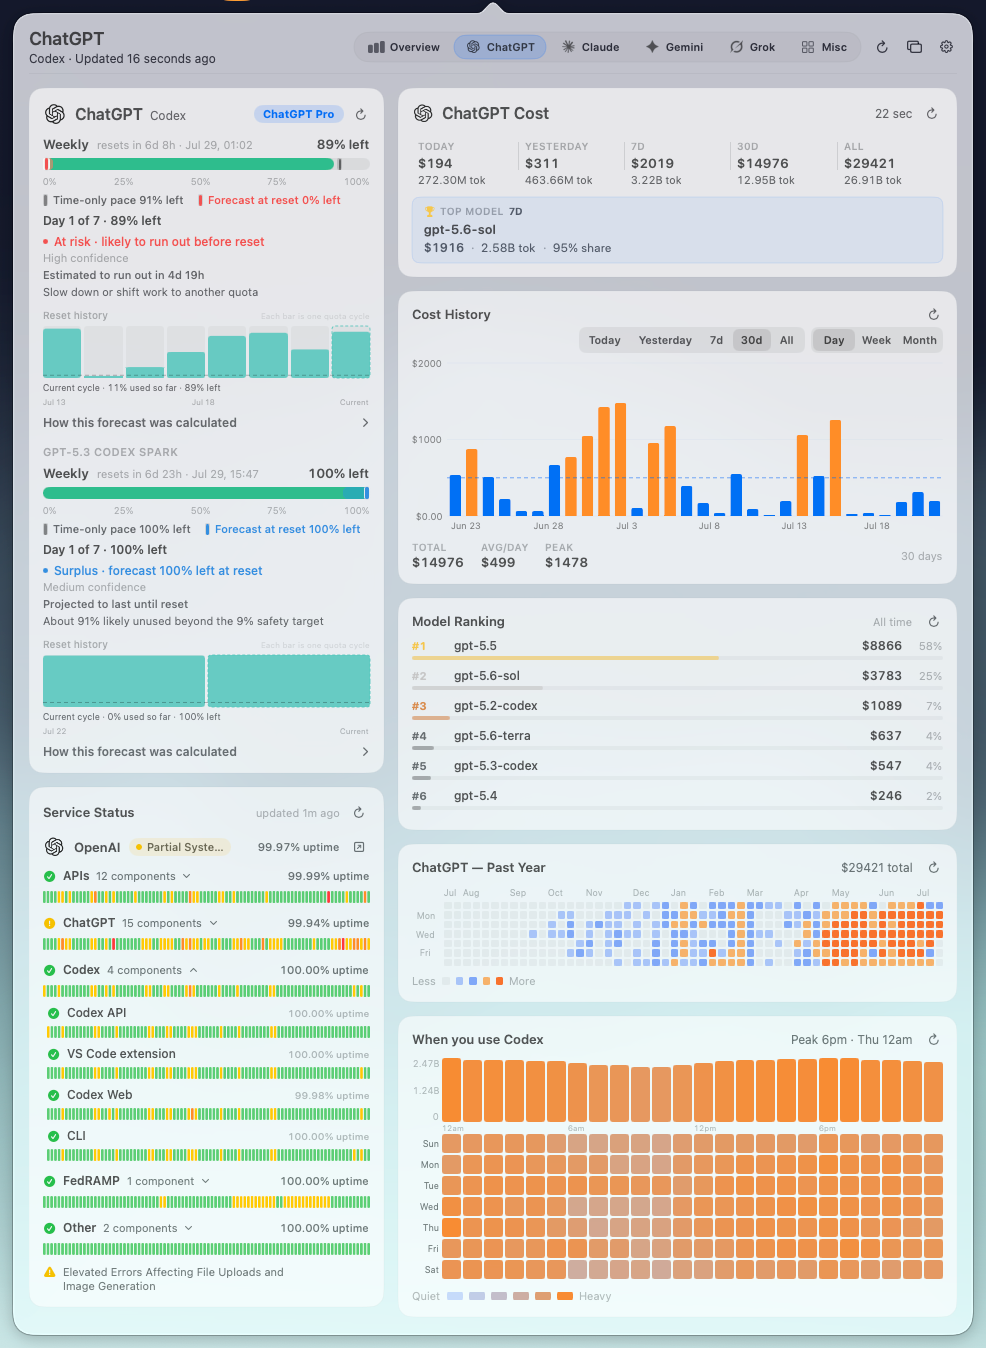
The header contains Overview, the visible core-provider tabs, and Misc. It also shows the newest relevant update time, refresh activity, mini-window toggle, and Settings button.
- Overview compares all visible core providers.
- ChatGPT, Claude, Gemini, and Grok open deeper product views.
- Misc shows enabled usage-only integrations.
The visible provider order follows Settings. Hiding a core provider removes its tab and Overview contribution without deleting history or credentials.
Read a quota row
A quota row should be read from top to bottom:
- Bucket name identifies the independently resetting limit.
- Percentage and bar show the current value in Remaining or Used mode.
- Reset countdown shows when the provider says the bucket refills.
- Pace compares use with elapsed time.
- Forecast estimates whether the quota will survive until reset.
- Confidence tells you how much evidence supports that estimate.
Model- or plan-specific branches can reset independently from the main 5-hour/weekly windows. Do not combine their percentages manually.
Quota forecasts
Quota cards combine the current percentage and reset time with a forecast:
| State | Meaning |
|---|---|
Learning | There is not enough history for a stable personal forecast yet. |
Enough | Current usage is on track to last through the reset window. |
Watch | The margin is narrowing and the pace deserves attention. |
At risk | The current pattern may run out before reset. |
Surplus | Usage is materially below the available quota pace. |
The forecast also surfaces projected run-out time, time-only pace, and confidence so that one label never pretends to be exact.
The dedicated Subscription Utilization view explains the forecast with recent burn, completed-cycle comparisons, activity weighting, evidence counts, coverage, the safety target, and the uncertainty interval. See Costs and forecasts for the model semantics.
Cost and token summaries
Local coding-agent records feed Today, Yesterday, 7-day, 30-day, and all-time cost and token views. Per-model rankings show which models account for the largest share.
These values are estimates derived from local usage records and model pricing. They are not a provider invoice.
Time presets and bucket granularity change the visible chart window, not the source files. Auto granularity follows the zoom level; hover shows a compact value and click opens model detail.
Reset-cycle history
Reset history shows how much quota remained at the end of previous windows. This makes recurring unused capacity visible and helps distinguish a one-off quiet week from a consistent subscription mismatch.
Activity patterns
- Daily, weekly, and monthly charts show cost over time.
- The yearly heatmap makes long streaks and quiet periods visible.
- The hour-of-week view maps activity across all 168 hours of a week.
Provider status
OpenAI, Anthropic, Google, and xAI status appears next to the usage data it can affect. Incidents and component uptime stay separate from local quota and cost calculations.
Provider details
Core providers use the same framework: quota, forecast, and reset history on the narrower side; cost, cost history, model ranking, past-year activity, and working-hour patterns on the wider side. The consistent layout makes it easier to compare products without relearning the controls.
Mini window
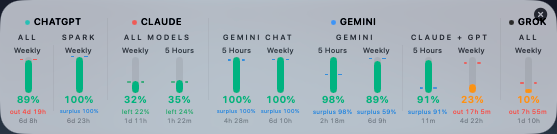
Use the regular mini window when readability from a distance matters. Choose the compact layout when screen space is tight.
- Regular and Compact keep separate selected fields.
- Double-click the window to switch modes.
- Drag it to another display; the position and open state are restored.
- Custom field and group labels can shorten long quota names.
- Misc providers are intentionally excluded.
Refresh and freshness
The circular refresh button requests data for the current visible surface. Scheduled refresh and optional popover-open refresh are configured separately.
Always read the timestamp together with the result. After a failed request, Vibe Bar keeps the last usable snapshot and exposes the error; it does not rewrite the old snapshot as a fresh success.